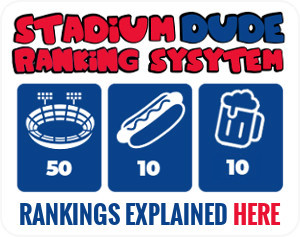
What is the best ballpark in baseball? Why not ask a guy who’s been to them all multiple times? I’ve ranked all 30 MLB ballparks from 30 to 1 using a ratings system that rewards both technical excellence, charm, and the overall fun experience from going to the game, not just the physical structure itself. This allowed for better judgment of parks of different eras, on a single scale.
Best Ballparks in Baseball: Stadium Dude’s MLB Stadium Rankings
| Rk | Stadium - Team | Stadium | Food | Beer | Hood | Cost | Access | Weather | Vibe | Total |
|---|---|---|---|---|---|---|---|---|---|---|
| 50 | 10 | 10 | 10 | 5 | 5 | 5 | 25 | |||
| The Bucket Listers | ||||||||||
| 1 | Wrigley Field (Cubs) | 41.5 | 7 | 7 | 10 | 1 | 3 | 2 | 25 | 96.5 |
| 2 | Petco Park (Padres) | 39 | 10 | 10 | 10 | 2 | 3 | 5 | 17 | 96 |
| 3 | PNC Park (Pirates) | 45 | 9 | 8 | 7 | 4 | 4 | 2 | 16 | 95 |
| 4 | Oracle Park (Giants) | 42.5 | 9 | 9 | 7 | 2 | 4 | 3 | 18 | 94.5 |
| 5 | Fenway Park (Red Sox) | 39 | 8 | 7 | 10 | 1 | 3 | 1 | 25 | 94 |
| 6 | Target Field (Twins) | 42 | 8 | 8 | 8 | 4 | 5 | 1 | 16 | 92 |
| 7 | Oriole Park at Camden Yards | 38.5 | 9 | 7 | 8 | 4 | 5 | 2 | 17 | 90.5 |
| The great stadiums | ||||||||||
| 8 | T-Mobile Park (Mariners) | 34 | 10 | 10 | 8 | 3 | 3 | 4 | 17 | 89 |
| 9 | Citizen's Bank Park (Phillies) | 38 | 9 | 7 | 5 | 3 | 4 | 2 | 20 | 88 |
| 10 | Citi Field (Mets) | 39.5 | 10 | 8 | 1 | 2 | 4 | 2 | 21 | 87.5 |
| 11 | Coors Field (Rockies) | 38 | 6 | 7 | 10 | 4 | 4 | 2 | 16 | 87 |
| 12 | Comerica Park (Tigers) | 40.5 | 6 | 8 | 7 | 3 | 3 | 2 | 17 | 86.5 |
| 13 | Yankee Stadium | 40 | 9 | 5 | 5 | 0 | 3 | 2 | 22 | 86 |
| 14 | Truist Park (Braves) | 36.5 | 8 | 7 | 8 | 2 | 1 | 3 | 20 | 85.5 |
| 15 | Progressive Field (Guardians) | 38 | 9 | 8 | 6 | 4 | 4 | 1 | 15 | 85 |
| 16 | Minute Maid Park (Astros) | 36.5 | 9 | 7 | 6 | 1 | 3 | 4 | 18 | 84.5 |
| 17 | Busch Stadium (Cardinals) | 36 | 6 | 5 | 6 | 3 | 4 | 2 | 22 | 84 |
| 18 | Dodger Stadium | 40 | 7 | 6 | 3 | 1 | 0 | 5 | 21 | 83 |
| 19 | American Family Field (Brewers) | 31.5 | 9 | 8 | 3 | 3 | 3 | 4 | 21 | 82.5 |
| 20 | Great American Ball Park (Reds) | 34 | 7 | 8 | 7 | 4 | 4 | 2 | 16 | 82 |
| 21 | Kauffman Stadium (Royals) | 41 | 8 | 7 | 2 | 3 | 2 | 2 | 16 | 81 |
| 22 | Nationals Park | 33 | 9 | 7 | 8 | 2 | 3 | 2 | 16 | 80 |
| The fun parks with flaws | ||||||||||
| 23 | loanDepot Park (Marlins) | 41.5 | 8 | 6 | 3 | 4 | 2 | 4 | 10 | 78.5 |
| 24 | Rogers Centre (Blue Jays) | 30 | 7 | 7 | 8 | 3 | 3 | 4 | 16 | 78 |
| 25 | Globe Life Field (Rangers) | 34.5 | 7 | 6 | 6 | 2 | 1 | 4 | 17 | 77.5 |
| 26 | Guaranteed Rate Field (White Sox) | 32 | 8 | 9 | 3 | 3 | 4 | 2 | 16 | 77 |
| 27 | Chase Field (Diamondbacks) | 28.5 | 6 | 6 | 7 | 4 | 4 | 4 | 16 | 75.5 |
| 28 | Angel Stadium | 29 | 6 | 6 | 5 | 3 | 2 | 5 | 16 | 72 |
| The “hey it’s baseball” parks | ||||||||||
| 29 | Tropicana Field (Rays) | 23 | 8 | 7 | 9 | 5 | 1 | 4 | 11 | 68 |
| 30 | Oakland Coliseum | 18 | 6 | 7 | 1 | 4 | 4 | 5 | 13 | 58 |
STADIUM SCORES BROKEN DOWN
Stadiums have been ranked in twelve different subcategories, and out of a total score of 110. That score is then divided by two to come up with the Stadium Only Score, for that particular stadium.
PNC Park led all stadiums with an impressive 91 of 100 possible points.
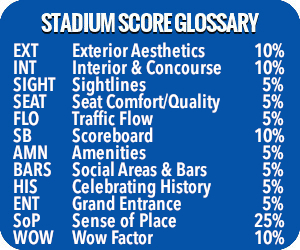
| Stadium | EXT | INT | SIGHT | SEAT | FLO | SB | AMN | BARS | HIS | ENTR | SoP | WOW | TOTAL |
|---|---|---|---|---|---|---|---|---|---|---|---|---|---|
| 10 | 10 | 5 | 5 | 5 | 10 | 5 | 5 | 5 | 5 | 25 | 10 | 100/2=50 | |
| PNC Park | 10 | 8 | 5 | 4 | 3 | 8 | 4 | 3 | 5 | 5 | 25 | 10 | 90/2 = 45 |
| Oracle Park | 9 | 5 | 4 | 4 | 3 | 9 | 4 | 5 | 5 | 5 | 22 | 10 | 85/2 = 42.5 |
| Target Field | 10 | 9 | 5 | 4 | 4 | 9 | 3 | 5 | 4 | 5 | 19 | 7 | 84/2 = 42 |
| loanDepot Park | 10 | 9 | 5 | 4 | 4 | 7 | 3 | 4 | 4 | 5 | 20 | 8 | 83/2 = 41.5 |
| Wrigley Field | 9 | 6 | 2 | 3 | 2 | 10 | 3 | 3 | 5 | 5 | 25 | 10 | 83/2 = 41.5 |
| Kauffman Stadium | 7 | 7 | 5 | 3 | 5 | 9 | 5 | 4 | 5 | 2 | 21 | 9 | 82/2 = 41 |
| Comerica Park | 10 | 9 | 3 | 3 | 4 | 9 | 4 | 4 | 5 | 5 | 18 | 7 | 81/2 = 40.5 |
| Yankee Stadium | 10 | 8 | 3 | 4 | 4 | 8 | 5 | 4 | 5 | 4 | 19 | 6 | 80/2 = 40 |
| Dodger Stadium | 6 | 8 | 5 | 4 | 2 | 9 | 4 | 3 | 5 | 3 | 22 | 9 | 80/2 = 40 |
| Citi Field | 9 | 8 | 3 | 4 | 4 | 10 | 4 | 5 | 5 | 5 | 14 | 8 | 79/2 = 39.5 |
| Petco Park | 9 | 10 | 4 | 4 | 1 | 8 | 5 | 5 | 4 | 3 | 17 | 78 | 78/2 = 39 |
| Fenway Park | 9 | 5 | 3 | 1 | 1 | 9 | 3 | 2 | 5 | 5 | 25 | 10 | 78/2 = 39 |
| Camden Yards | 10 | 6 | 3 | 3 | 5 | 5 | 3 | 3 | 4 | 5 | 21 | 9 | 77/2 = 38.5 |
| Coors Field | 10 | 8 | 4 | 4 | 5 | 8 | 4 | 5 | 2 | 5 | 13 | 8 | 76/2 = 38 |
| Citizen’s Bank Park | 5 | 10 | 5 | 4 | 5 | 8 | 4 | 5 | 4 | 4 | 16 | 6 | 76/2 = 38 |
| Progressive Field | 8 | 6 | 2 | 3 | 4 | 10 | 5 | 5 | 5 | 4 | 17 | 7 | 76/2 = 38 |
| Truist Park | 6 | 9 | 4 | 5 | 4 | 8 | 5 | 5 | 5 | 5 | 10 | 7 | 73/2 = 36.5 |
| Minute Maid Park | 9 | 7 | 4 | 4 | 5 | 7 | 3 | 3 | 4 | 4 | 16 | 7 | 73/2 = 36.5 |
| Busch Stadium | 8 | 4 | 4 | 4 | 3 | 6 | 3 | 2 | 4 | 5 | 23 | 6 | 72/2 = 36 |
| Globe Life Field | 5 | 9 | 5 | 5 | 5 | 7 | 3 | 3 | 5 | 5 | 11 | 6 | 69/2 = 34.5 |
| Great American | 5 | 7 | 3 | 4 | 2 | 8 | 4 | 3 | 5 | 4 | 17 | 6 | 68/2 = 34 |
| T-Mobile Park | 4 | 9 | 4 | 3 | 4 | 9 | 4 | 5 | 4 | 4 | 11 | 7 | 68/2 = 34 |
| Nationals Park | 8 | 9 | 4 | 4 | 5 | 6 | 4 | 3 | 4 | 3 | 13 | 3 | 66/2 = 33 |
| Guaranteed Rate Field | 7 | 8 | 2 | 4 | 4 | 9 | 4 | 4 | 4 | 4 | 10 | 4 | 64/2= 32 |
| American Family Field | 6 | 6 | 3 | 3 | 3 | 8 | 5 | 4 | 5 | 4 | 9 | 7 | 63/2 = 31.5 |
| Rogers Centre | 3 | 8 | 3 | 4 | 3 | 8 | 4 | 4 | 2 | 2 | 13 | 6 | 60/2 = 30 |
| Angel Stadium | 5 | 6 | 3 | 3 | 4 | 8 | 3 | 3 | 3 | 5 | 12 | 3 | 58/2 = 29 |
| Chase Field | 4 | 7 | 2 | 4 | 4 | 8 | 3 | 4 | 2 | 4 | 10 | 5 | 57/2 = 28.5 |
| Tropicana Field | 4 | 6 | 3 | 3 | 3 | 2 | 5 | 4 | 2 | 4 | 8 | 2 | 46/2 = 23 |
| Oakland Coliseum | 1 | 3 | 1 | 3 | 2 | 4 | 3 | 4 | 3 | 1 | 8 | 3 | 36/2 = 18 |

Top 5 Atmospheres in MLB
1. Wrigley Field
2. Fenway Park
3. Busch Stadium
4. Yankee Stadium
5. CitiField
Top 5 By Beer & Food
1. Petco Park
2. T-Mobile Stadium
3. CitiField
4. Oracle Park
5. Progressive Field
Top 5 Neighborhoods in MLB
1. Wrigleyville (Cubs)
2. Gaslamp District (Padres)
3. Fenway/Back Bay (Red Sox)
4. LoDo (Rockies)
5. DT St Pete (Rays)
Ratings and Rankings Explanation
While there’s rigor to the ratings, there’s always subjectivity. What I find beautiful, you may not. What I find delicious, you may not…